Data & diagrams
Understand-Anything
Maps an unfamiliar codebase into a graph you can interrogate
★ 82k
September 2026
MIT
Data & diagrams
What we checked ourselves
Not copied from the project's own blurb. These are things we opened and verified, with the date.
- 9 Sept 2026We checked that the link to the project still resolves.
- 13 Sept 2026We read the licence text itself (LICENSE). No unusual restrictions were stated.
- 2 Sept 2026We read the project's own documentation and found no sign that development has stopped.
Where this sits among the 35 tools we list in Data & diagrams
- Commercial use confirmed as allowed20 of 35
- Requires terminal commands24 that do not →
- Requires an API key20 that do not →
- Sends your input to the provider6 that do not →
Counted from our own checks: every tool we list is examined against the same criteria.
What it does
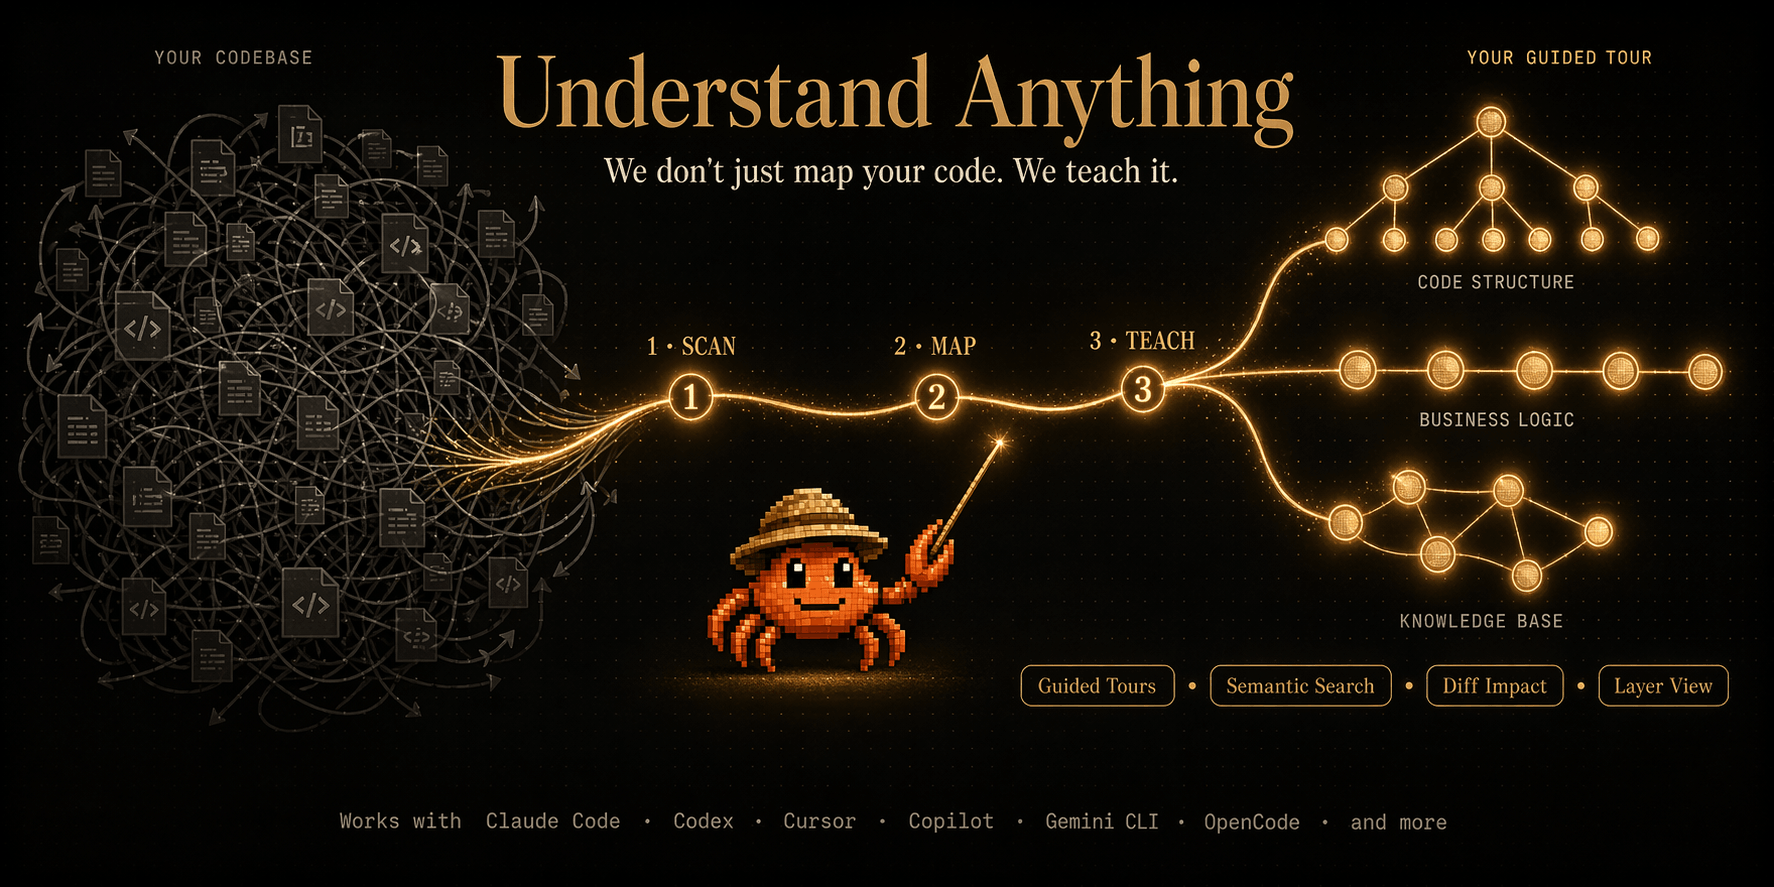
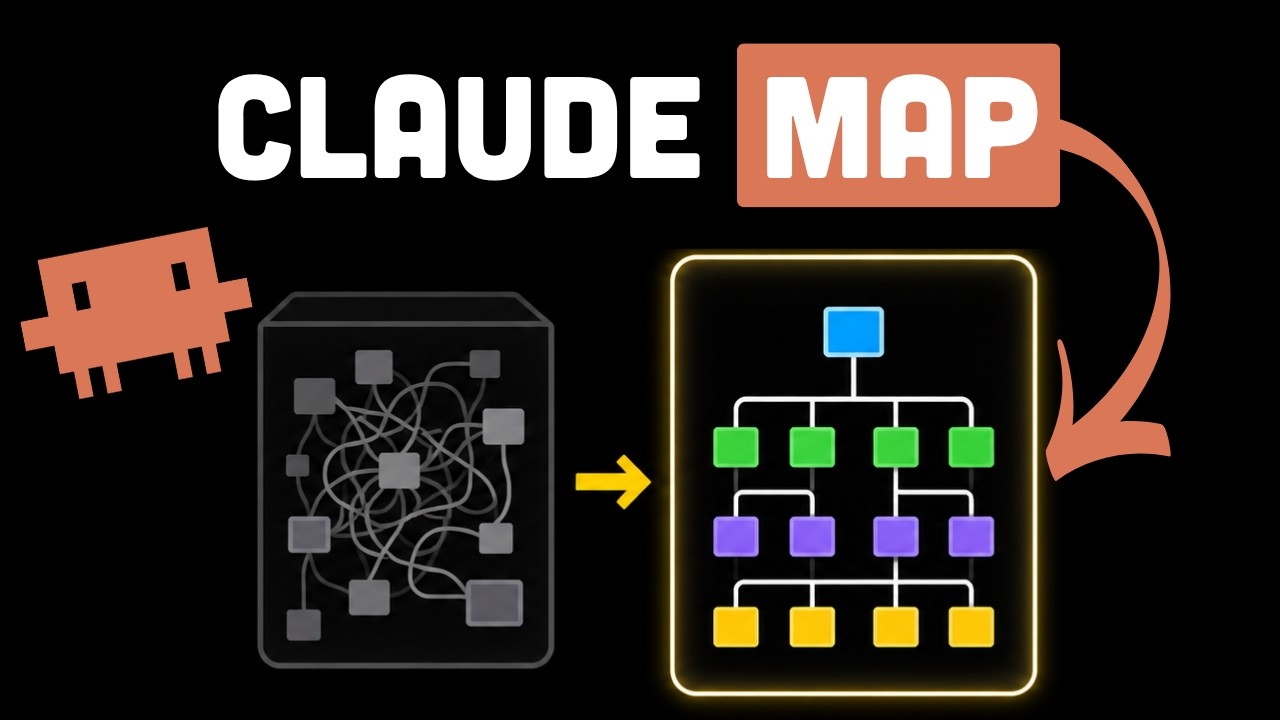
Point it at 200,000 lines you have never seen and a multi-agent pipeline builds a knowledge graph of every file, function, class and dependency, then hands you a dashboard to explore and question it rather than reading blind. Installs as a plugin into Claude Code, Codex, Cursor, Copilot or Gemini CLI. The code being analysed goes to whichever model you have configured, which is the thing to check before pointing it at work repositories. Docs are available in Japanese among other languages. MIT.
Summary based on the project's own description. The Japanese page has a fuller beginner guide: setup difficulty, what to prepare, and a step-by-step start.
Screenshots & visuals
Before you start
- Setup difficultySome setup needed
- Command lineRequired
- API keyRequired
- Sends data onlineYes
Judged automatically from the project's own metadata. Always confirm on the official page.
Understand-Anything FAQ
- Is Understand-Anything free?
- Understand-Anything itself is free, but it needs an API key for an external AI service. That service charges separately, though some have a free tier.
- Do I need to install anything or write code to use Understand-Anything?
- It needs the command line. If you are not comfortable typing commands, expect to get stuck during setup.
- Does Understand-Anything work on a phone?
- No. It needs a computer.
- Can I use Understand-Anything commercially?
- The licence is MIT, which permits commercial use. Conditions such as keeping the copyright notice still apply, so read the licence text before shipping it inside something.
How it compares
The conditions that decide whether you can actually use it, side by side.
| Tool | Command line | API key | Sends data out | Phone | Commercial use |
|---|---|---|---|---|---|
| Understand-Anything (this page) | Required | Required | Yes | No | Yes |
| worldmonitor | Required | Required | Yes | No | Yes |
| OpenBB | Required | Required | Yes | No | Not verified |
| PandasAI | Required | Required | Yes | No | Yes |
"Sends data out" means your input is uploaded to someone's server. Pick "No" when the material cannot leave your organisation.